Work Package 1 of the PROTEGO project provides a critical foundation for understanding and addressing marine litter by identifying where plastic waste originates, how it moves through human and environmental systems, and where it accumulates. Through a combination of waste audits, sampling transects, brand audits, and interviews, the project identified four key hotspots, two in Ghana and two in Nigeria, each illustrating unique yet interconnected plastic leakage dynamics. The approach was designed to diagnose not only the volume and composition of waste, but also the human behaviors and infrastructural limitations that enable its entry into marine ecosystems.
Ada Foah
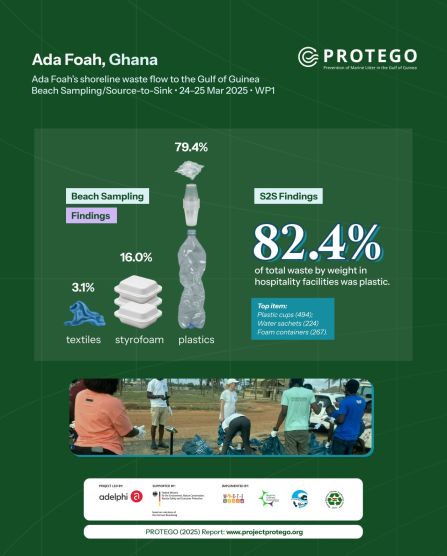
Ada Foah is a rapidly growing coastal tourism hub at the mouth of the Volta River. The area lacks formal waste infrastructure, especially for hotels and guesthouses, many of which rely on informal collectors or on-site dumping. The Source-to-Sink audit and beach litter transect provided clear evidence that waste generated inland is leaking directly to the coast due to wind, runoff, and poor disposal practices.
Audits of 22 hospitality facilities revealed an overwhelming dependence on plastic packaging, especially bottled water and sachets. While per-guest waste quantities appeared low, the plastic share was alarmingly high. These findings were mirrored in beach litter, dominated by plastic items such as cups, wrappers, and sachets, pointing to direct correlations between consumption patterns and shoreline debris.
Key figures:
82.4% of total waste by weight in hospitality facilities was plastic.
1,326 litter items collected on the beach; 79.4% were plastics, 16% styrofoam, 3.1% textiles.
Top item: Plastic cups (494); others included water sachets (224) and foam containers (267).
Top brands: Aqua-Gold, Perla, Bel-Aqua, and others.
Guesthouses generated more waste than hotels, up to 1.52 kg/day.

Tema (RMU and GPHA Beaches)
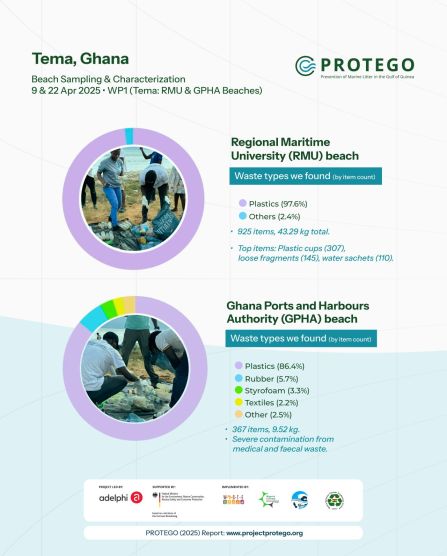
In Tema, a high-density urban and industrial center, PROTEGO conducted beach litter assessments at two strategic sites. The RMU beach represented a semi-public area with educational and recreational activity, while the GPHA beach, near the port, reflected industrial and low-income urban influences.
At RMU, almost all the waste collected was plastic mostly lightweight and single-use. GPHA, although smaller in quantity, had far greater material diversity and included hazardous medical waste, faeces, and even pharmaceuticals, highlighting serious gaps in sanitation and environmental protection.
Key figures:
RMU:
925 items, 43.29 kg total.
97.6% plastic waste by item count.
Top items: Plastic cups (307), loose fragments (145), water sachets (110).
GPHA:
367 items, 9.52 kg.
86.4% plastics, 5.7% rubber, 3.3% styrofoam, 2.2% textiles, 0.8% glass.
Severe contamination from medical and faecal waste.

Calabar (Nsidung and Atansinya Markets)
In Calabar, PROTEGO studied two riverside markets: Nsidung and Atansinya, located along the Calabar River. These informal, high-traffic markets produce substantial volumes of unmanaged waste with almost no access to structured collection. Waste is routinely dumped into the river or in nearby informal sites.
At Nsidung, the waste stream was highly diverse, including cartons, plastic packaging, and glass bottles. A significant percentage of vendors admitted to dumping directly into the river. At Atansinya, waste generation was lower but almost entirely composed of plastic, especially water sachets and soft packaging, again with very little containment or formal collection.
Key figures:
Nsidung:
459 items, 3.15 kg from 4 vendor groups.
40.7% plastics by weight; rest: cardboard (28.1%), glass (16.5%), textiles (6.6%).
90% of annual waste (≈18,427 kg) leaks into the environment.
Average daily waste per vendor: 315 g.
Annual waste projection: ~20,475 kg.
Atansinya:
229 items, 1.6 kg from 70 vendors.
100% plastic (by weight and item count).
Water sachets = 60%, other flexible packaging = 35%.
Annual waste: ~499 kg, with 90% leakage.
